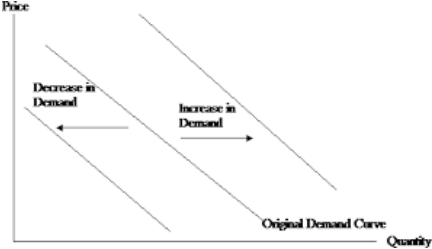
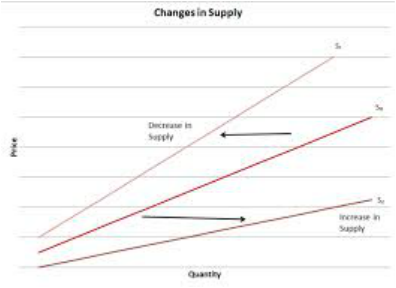
Supply and demand schedule graphs do not always stay in the same in the same spot. Anything that moves the graph left or right is called a shifter. If the graph is moved to the right, that means that the quantity in increasing. If the graph moves to the left, the quantity is decreasing. Both supply and demand graphs have different factors that can cause it to move left or right. The following are acronyms to help you remember the different factors.
Demand Shifters- B.I.T.E.R.
Buyers
Income
Tastes and preferences
Expectations
Related goods
1. Buyers- buyers are the number of people that are willing and able to buy the product. For example, if the town you lived in recently had an increase in the number of teenagers that live there, there would most likely be an increase in the number of school supplies sold
2. Income- How much money each household makes affects how much money they can spend. If the average family income decreases by 20%, it is most likely that it will cause a shift to left on the graph since they will not be willing and able to buy as much product.
3. Tastes and preferences- People have different interests and hobbies and this can affect the products they buy. If for example a new shoe company becomes really popular among people, it will cause the graph to shift right because more people will want it.
4. Expectations- If a buyer know that price of a certain product will change in the future, it will most likely affect when they will buy the product. If they think the price of the product will decrease in the future, they will buy less of the product now causing a shift to the left on the graph.
5. Related goods- related goods are products that are usually sold together or can be sold instead of a different one. If the price of a new phone decreases, more people will probably buy the phone and it will increase the sale of phone cases for that phone causing a shift to the right.
Supply Shifters- T.O.N.E.R.S.
Technology
Other Goods
Number of sellers
Expectations
Resource Cost
Subsidies and Taxes
1. Technology- The faster and better the technology is, the faster product can be produced. If a company has newer technology, it is most likely that they will be able to increase their production causing a shift to the right on the graph.
2. Other goods- when the production of a related good decreases or increases it has a direct effect on the production of the other good. If production of baseball bats decreases, the production of baseball gloves will also decrease.
3. Number of sellers- Number of sellers refer to how people are selling the product. If all the farmers around the country have a good season of harvesting corn, the amount of sellers will increase, causing a shift to the right on the graph.
4. Expectations- expectations for supplier are exact opposite of those of buyers. If a supplier thinks that the price of a product will increase in the near future, the try to sell little now and more later so they can make more money, This will cause a shift to the left.
5. Resource cost- resource cost is how much money it takes to make a product. If for example you own a coffee shop and the price of coffee beans increases, you will probably sell less product since it is now more expensive to make coffee. This causes a shift to the left.
6. Subsidies and taxes- both of these refer to government involvement. A subsidy is money that government pays to a company to produce a certain product. If the government pays you $20,000 more per year in subsidies to produce ice cream, you will most likely produce more ice cream. On the opposite hand, if the government taxes you to make a certain product, they are making you pay to make the product. If you owe the government $20,000 more to produce ice cream, you will probably slow your production of ice cream.
Summary
Shifters play an important roll in shaping our economy. Understanding what each shifter does and how if affects supply and demand, can help us better understand and predict the economy. Knowing this information benefits both the producer and consumer by letting them know what might happen in the near future. It helps shape their decisions on what to produce and buy.
Shifters play an important roll in shaping our economy. Understanding what each shifter does and how if affects supply and demand, can help us better understand and predict the economy. Knowing this information benefits both the producer and consumer by letting them know what might happen in the near future. It helps shape their decisions on what to produce and buy.
